measure the perihelion precession rates for a number of objects to quantify the effects of general relativity (GR) and solar oblateness.
More at http://mel.epss.ucla.edu/jlm/research/NEAs/GR/
Based on this list, we can get the following data:
|
- Graph 1 - dw vs SLR (parameter = quartile of dr)
- Graph 2 - dw vs dr (parameter = quartile of SLR)
Graph 1 - dw vs SLR (parameter = quartile of dr)
> quantile of dr (km/y)
     0%     25%     50%     75%    100%
 48.800  55.425  66.300  80.300 171.000

Graph 2 - dw vs dr (parameter = quartile of SLR)
> quantileof SLR (au)
     0%     25%     50%     75%    100%
0.17400 0.37400 0.48550 0.58675 0.66400
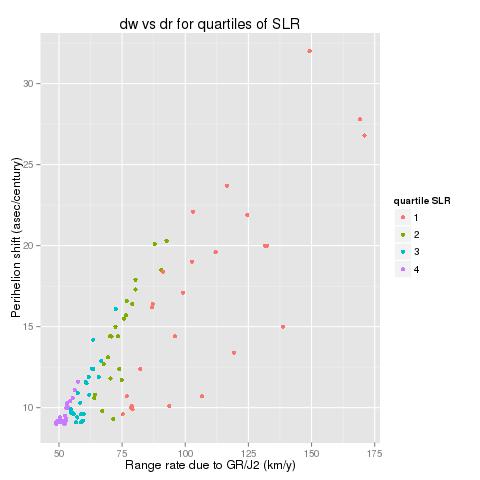
It seems to me that both graphs show (as expected) that the more an asteroid comes near the sun the more important is the dr effect.
The same is true for the dw effect but I do not understand this:
- dw belongs to an area defined by two almost linear boundaries (the slope of the higher boundary is greater than the slope of the lower boundary , thus we see a "triangular shape"...)
Why does this happen?
Multiple regression
Coming back to easier considerations, there may be another way to show the relation between dw, dr and SLR.
Look at the multiple regression fit that predicts dw based on SLR and dr taking into
account the interaction between SLR and dr:
account the interaction between SLR and dr:
> summary(fit)

Call:
lm(formula = dw ~ SLR * dr, data = p)

Residuals:
     Min       1Q   Median       3Q      Max
-2.15438 -0.30660  0.04085  0.24131  3.13628

Coefficients:
              Estimate Std. Error t value Pr(>|t|)
(Intercept) -27.820350   0.981042 -28.358  < 2e-16 ***
SLR          -6.124334   1.318151  -4.646 1.15e-05 ***
dr            0.146494   0.006126  23.912  < 2e-16 ***
SLR:dr        1.038595   0.028026  37.059  < 2e-16 ***
---
Signif. codes:  0 ‘***’ 0.001 ‘**’ 0.01 ‘*’ 0.05 ‘.’ 0.1 ‘ ’ 1

Residual standard error: 0.5601 on 90 degrees of freedom
Multiple R-squared:  0.9863, Adjusted R-squared:  0.9859
F-statistic:  2163 on 3 and 90 DF,  p-value: < 2.2e-16
dw - Fitted values vs original values

This is the normal probability plot used to see how much the residuals of the model are
normally distributed:

Kind regards,
Alessandro Odasso


