Blog Archive

Sunday, May 12, 2019

2017 FO161

I refer to this message from Sam Deen published on the MPML list.

For what's worth due to the extreme orbit uncertainty (condition code 9), I tried to make a simulation.

JPL Small-Body Database Browser
Ephemeris | Orbit Diagram | Orbital Elements | Physical Parameters ]

[ show orbit diagram ]

Orbital Elements at Epoch 2457968.5 (2017-Aug-03.0) TDB
Reference: JPL 2 (heliocentric ecliptic J2000)
 Element Value Uncertainty (1-sigma)   Units 
e .4495582354653219 0.16822
a 61.51516382073726 11.543 au
q 33.86051531912641 3.9954 au
i 54.05413287988313 0.053617 deg
node 164.9909556914857 0.0017229 deg
peri 145.4085682131792 32.795 deg
M 251.4476070979913 79.839 deg
tp 2511106.916053698100
(2163-Jan-28.41605370)
24126 TDB
period 176226.6981677686
482.48
49602
135.8
d
yr
n .002042823271064628 0.00057499 deg/d
Q 89.16981232234812 16.732 au

Orbit Determination Parameters
   # obs. used (total)      14  
   data-arc span      354 days  
   first obs. used      2017-03-23  
   last obs. used      2018-03-12  
   planetary ephem.      DE431  
   SB-pert. ephem.      SB431-N16  
   condition code      9  
   norm. resid. RMS      .23801  
   source      ORB  
   producer      Otto Matic  
   solution date      2019-Feb-11 05:48:07  

Additional Information
 Earth MOID = 32.9588 au 
 Jupiter MOID = 29.3689 au 
 T_jup = 3.690 
(2017 FO161)
Classification: TransNeptunian Object          SPK-ID: 3802117

Simulation
I generated 100 clones, trying to achieve the same distribution shown above.

Note: given the  uncertainty, the assumption of "normality" may not hold ...so this is another reason not to trust "blindly" the simulation results.


Clones
Target

mean sd
mean sd
q 33.3889976 3.99529506
33.86051532 3.9954
e 0.46907446 0.16820753
0.44955824 0.16822
i 54.04937496 0.05360707
54.05413288 0.053617
peri 141.63264456 32.79320364
145.40856821 32.795
node 164.99111511 0.00172288
164.99095569 0.0017229
tp 2508314.74330338 24125.06256158
2511106.9160537 24126


I configured the Mercury6 simulator (*) with an ejection distance equal to 100AU and integration algorithm Bulirsch-Stoer.

(*)
J.E.Chambers (1999) ``A Hybrid
      Symplectic Integrator that Permits Close Encounters between
      Massive Bodies''. Monthly Notices of the Royal Astronomical
      Society, vol 304, pp793-799.

Simulation Result


Do you think that a "still dormant" comet, constituted mainly by ice, can explain the fact that the object is brighter than expected?

Kind Regards,
Alessandro Odasso

Sunday, October 21, 2018

2011 DL12 = K11D12L -- Cometary Origin?

2011 DL12 is an outer main-belt asteroid.

I have downloaded the orbital parameters  from JPL Small-Body Database Browser:

Ephemeris | Orbit Diagram | Orbital Elements | Mission Design | Physical Parameters | Close-Approach Data ]

[ show orbit diagram ]

Orbital Elements at Epoch 2458600.5 (2019-Apr-27.0) TDB
Reference: JPL 4 (heliocentric ecliptic J2000)
 Element Value Uncertainty (1-sigma)   Units 
e .3332919522378502 1.7048e-05
a 3.813848977356317 0.00010804 au
q 2.542723806152901 1.7234e-05 au
i 13.48245115796516 0.00011571 deg
node 329.3312783932701 0.00010623 deg
peri 151.9591228706485 0.0023481 deg
M 48.29805632413862 0.016968 deg
tp 2458235.518528997214
(2018-Apr-27.01852900)
0.11275 TDB
period 2720.468266449358
7.45
0.1156
0.0003165
d
yr
n .1323301596419123 5.6232e-06 deg/d
Q 5.084974148559733 0.00014405 au
Orbit Determination Parameters
   # obs. used (total)      22  
   data-arc span      413 days (1.13 yr)  
   first obs. used      2010-01-15  
   last obs. used      2011-03-04  
   planetary ephem.      DE431  
   SB-pert. ephem.      SB431-N16  
   condition code      4  
   fit RMS      .85076  
   data source      ORB  
   producer      Otto Matic  
   solution date      2018-Oct-18 05:08:18  

Additional Information
 Earth MOID = 1.56728 au 
 Jupiter MOID = .136519 au 
 T_jup = 2.934 
(2011 DL12)
Classification: Outer Main-belt Asteroid          SPK-ID: 3558704

I generated 100 clones trying to achieve the same nominal orbital parameters and uncertainty as calculated by JPL.

The result (achieved vs target) is shown in this table:

Clones Target
mean sd mean sd
q 2.54272169 1.715e-05 2.54272381 1.723e-05
e 0.33329091 1.712e-05 0.33329195 1.705e-05
i 13.48245868 0.00011564 13.48245116 0.00011571
peri 151.95937755 0.00234384 151.95912287 0.0023481
node 329.33127117 0.00010601 329.33127839 0.00010623
tp 2458235.53032508 0.11307094 2458235.518529 0.11275

Backward Simulation

As shown below, I investigated what could have happened to the clones in the past going back to -100 million JD (about 280K years in the past).

As arbitrary threshold to declare that an object is likely to have a cometary origin, I set ejection distance = 100 AU
 
Algorithm: Bulirsch-Stoer

Non gravitational effects: not taken ito account.

Software: Mercury 6 

 ===>  reference for the package: J.E.Chambers (1999) ``A Hybrid
      Symplectic Integrator that Permits Close Encounters between
      Massive Bodies''. Monthly Notices of the Royal Astronomical
      Society, vol 304, pp793-799.


)O+_06 Integration parameters  (WARNING: Do not delete this line!!)
) Lines beginning with `)' are ignored.
)---------------------------------------------------------------------
) Important integration parameters:
)---------------------------------------------------------------------
 algorithm (MVS, BS, BS2, RADAU, HYBRID etc) = BS
 start time (days)= 2458200.5
 stop time (days) = -1d8
 output interval (days) = 100
 timestep (days) = 0.05
 accuracy parameter=1.d-12
 ...

 ejection distance (AU)= 100
 

Simulation Results

(all analysis and plots below are done with R version 3.5.1 (R: A Language and Environment for Statistical Computing) using many libraries including library ggplot and viridis).

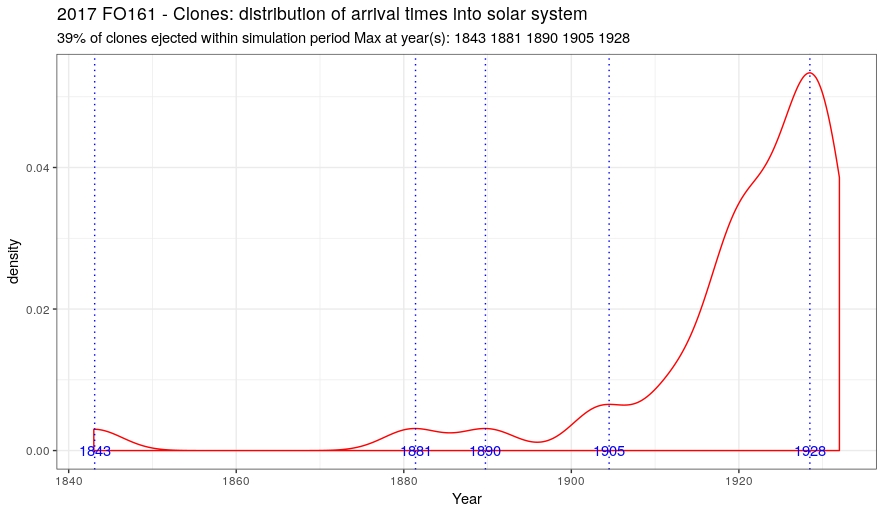
Going back in the past, 77 out of 100 clones seem to have a cometary origin because they entered the solar system coming from a distance greater than 100 AU.

As the simulation is backward, this plot should be read from right to left: we can see that many of the initial 100 clones are slowly "ejected" from the solar system (i.e. they entered in the solar system):

This plot show the density distribution of the arrival time in the solar system:

It seems that the most of the clones arrived in the solar sytem about 35000 years ago.

Footprint plots
If we forget the temporal dimension, we can draw some "footprint" plots that show where the clones were for most of the time:


Time plots
In the following plots, we take again into consideration the temporal dimension.

We start defining 10 time slots.
We take the first time slot and consider the first clone: we calculate the mean (or min/max) of an orbital parameter. Thus, we have one value.
Then, we do the same calculation for the other clones in the first time slot and we draw the resulting boxplot showing the distribution of all values.
The number of clones contributing to each interval in written over the boxplot itself.
The process is repeated for every time slot.

minimum value of perihelium

In case of aphelium, we need to discard a couple of outliers in order to be able to see the boxplots that otherwise would be too much "compressed":

maximum value of aphelium 


maximum value of eccentricity:
mean value of inclination 
mean value of w
mean value of om


In the energy plot, clones with hyperbolic orbits have energy greater than 0

maximum value of energy 


For hyperbolic clones we can show the Vinfinity while for the other we can show the orbital period (in the latter case, we discard a few outliers to better see the boxplots):

maximum value of Vinfinity  
maximum value of orbital Period 

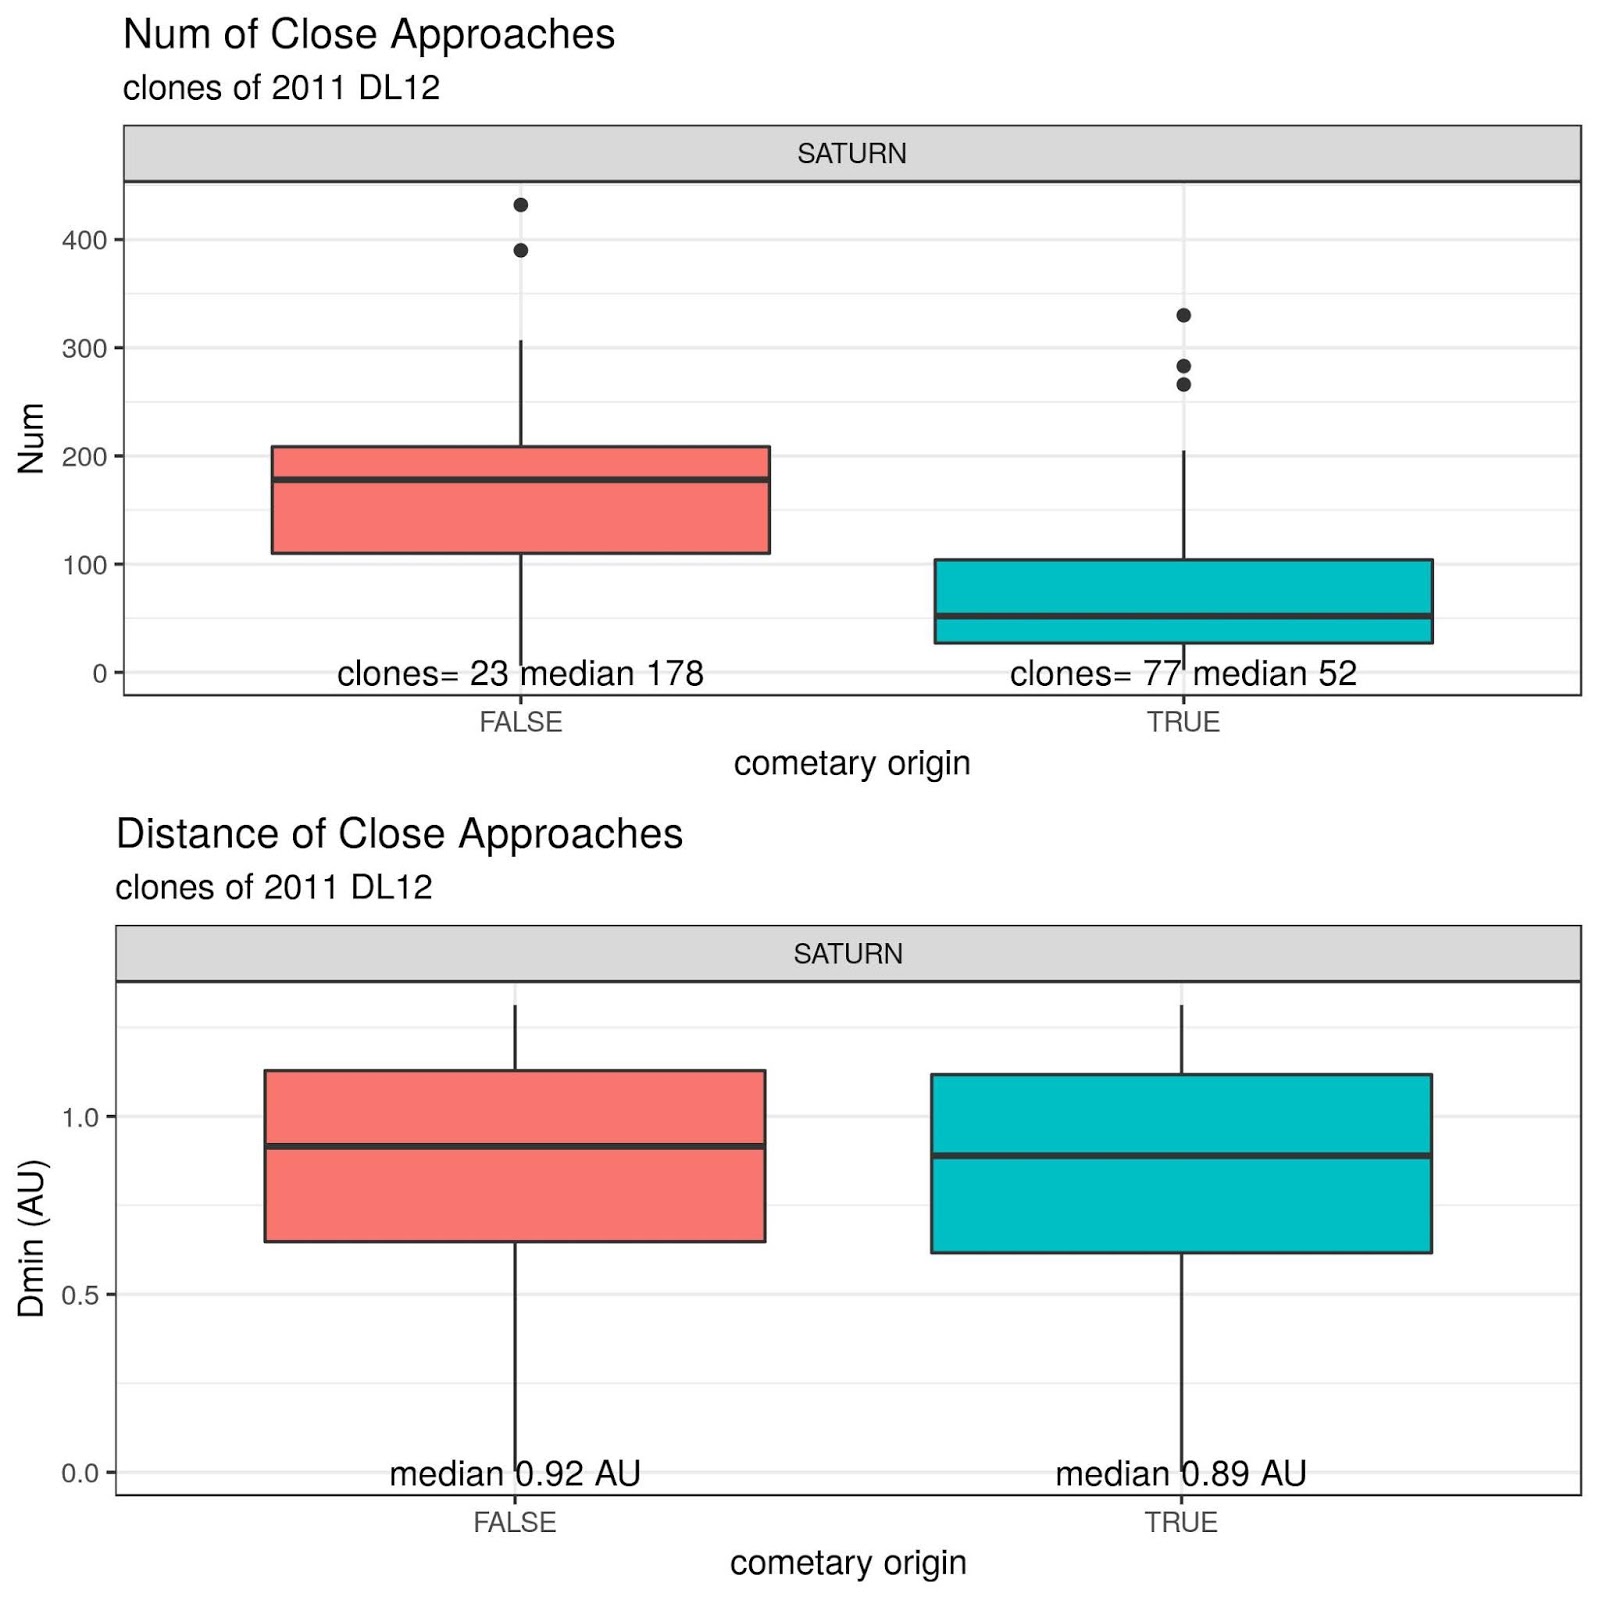
Analysis of close encounters


Kind Regards,
Alessandro Odasso

Tuesday, October 9, 2018

about TNO - Range (226 - 1600] AU

In the previous message, I have noticed that if you sort TNO by semi-major axis and look at the top 5% asteroids, you get  a plot like this when you count the number of TNO with 2<=Tap<=3 (Tap = Tisserand parameter calculated for a generic planer with semi-major axis = ap):


The above plot is contributed by 107 TNOs.

What happens if you divide the above range (91.6 - 1600) AU into quartiles containing about 25 TNOs and analyze each interval?

You get these plots:

The relative maxima (highlighted by a green vertical line) are at about:
  • 150 AU
  • 180 AU
  • 300 AU
  • 700 AU

Again, I wonder whether the value 700 AU is just a coincidence (this is the semi-major axis of hypotethical Planet IX).
Also, we can note that there is an important contribution around 40-50 AU

Range (226 - 1600] AU
In this range we can see a relative maximum at ap = 700 AU
 
The TNOs that belong to this range are the following ones (including Sedna, the recently found (2015 TG387) and (2012 VP113):
a e i om w
(2015 RY245) 227.8024555331 0.862742794022662 6.02579057401376 341.482534287424 354.379197127984
(1996 PW) 253.360837265531 0.990159010876786 29.9564761499396 144.38344890968 181.599728786903
(2012 VP113) 257.670644084881 0.687879948137137 24.1098643272105 90.6795458316776 293.616585249803
(2011 OR17) 267.62292506094 0.988371756092761 110.50391097494 271.443208707997 14.0658781504528
523719 (2014 LM28) 277.831093719718 0.939635865307078 84.7387523405941 246.178631712983 38.3643481614205
336756 (2010 NV1) 290.079238904053 0.967604322181253 140.749066145312 136.12865174322 132.653401330885
(2014 SR349) 303.688812847671 0.843030035231188 17.9784555874619 34.7970603621366 340.9130466591
(2013 FT28) 310.616250286609 0.860083663649765 17.3373719033496 217.770979685592 40.5386236787914
474640 (2004 VN112) 319.030257013192 0.851750858061802 25.59923139738 65.9764025946988 326.79999934344
(2015 GT50) 324.376802633332 0.881380238783511 8.7830884236707 46.0926336967559 129.328691760594
(2010 GB174) 350.594295543395 0.86096080378873 21.5863384533732 130.834994060552 347.447039201188
(2013 RF98) 357.875680246011 0.89920589784544 29.5866288844056 67.5780554516926 311.60258271302
418993 (2009 MS9) 368.487142381523 0.970179216772268 68.0660878375908 220.219433266459 128.567138515509
(2010 BK118) 389.145964196596 0.984348164069148 143.920199567286 175.941078666813 178.818657782284
(2015 RX245) 416.893254246754 0.890708576281222 12.1442299283332 8.59935840940333 65.1236515168313
(2015 BP519) 428.027266563915 0.917819042035429 54.1249991475254 135.107945553683 348.369423899309
523622 (2007 TG422) 472.770400320918 0.924843603208057 18.6197089456926 112.840026264392 285.537555783418
90377 Sedna (2003 VB12) 479.904866256856 0.841319584894813 11.9299242495342 144.327455233507 311.537354629566
(2013 AZ60) 484.397145476081 0.98363520249315 16.5359964047277 349.217448669393 158.442004096158
87269 (2000 OO67) 530.123370592557 0.960895340434559 20.0714845859386 142.254938715792 212.260873064693
(2013 SY99) 690.436183999428 0.927540233739612 4.22812585166895 29.4926598948928 32.0370907419145
(2015 KG163) 833.924720518964 0.951438398457847 13.9710168392877 219.066912107087 32.1814864999031
308933 (2006 SQ372) 904.113070520086 0.97329765168653 19.4838316640774 197.35069393261 122.323597503501
(2013 BL76) 966.427374233357 0.991354934255776 98.5918528472484 180.146423518858 165.869112499064
(2015 TG387) 1094.03723933517 0.940644000179443 11.6569634176564 300.812384068154 118.173821344875
(2014 FE72) 1505.44081025962 0.975865331102204 20.6550437712073 336.883214197736 134.161930450064
(2012 DR30) 1603.442512224 0.99091354190591 77.9863761979072 341.477038650836 195.571835807795
 
Those specific TNOs that contribute to the relative maxima with ap=700 AU are the following 14 ones (there is Sedna, but in this case, we do not see the recently found (2015 TG387) and we do not see (2012 VP113).
a e i om w
(1996 PW) 253.360837265531 0.990159010876786 29.9564761499396 144.38344890968 181.599728786903
(2011 OR17) 267.62292506094 0.988371756092761 110.50391097494 271.443208707997 14.0658781504528
523719 (2014 LM28) 277.831093719718 0.939635865307078 84.7387523405941 246.178631712983 38.3643481614205
336756 (2010 NV1) 290.079238904053 0.967604322181253 140.749066145312 136.12865174322 132.653401330885
(2014 SR349) 303.688812847671 0.843030035231188 17.9784555874619 34.7970603621366 340.9130466591
(2013 FT28) 310.616250286609 0.860083663649765 17.3373719033496 217.770979685592 40.5386236787914
474640 (2004 VN112) 319.030257013192 0.851750858061802 25.59923139738 65.9764025946988 326.79999934344
(2015 GT50) 324.376802633332 0.881380238783511 8.7830884236707 46.0926336967559 129.328691760594
(2010 GB174) 350.594295543395 0.86096080378873 21.5863384533732 130.834994060552 347.447039201188
(2013 RF98) 357.875680246011 0.89920589784544 29.5866288844056 67.5780554516926 311.60258271302
418993 (2009 MS9) 368.487142381523 0.970179216772268 68.0660878375908 220.219433266459 128.567138515509
(2015 RX245) 416.893254246754 0.890708576281222 12.1442299283332 8.59935840940333 65.1236515168313
523622 (2007 TG422) 472.770400320918 0.924843603208057 18.6197089456926 112.840026264392 285.537555783418
90377 Sedna (2003 VB12) 479.904866256856 0.841319584894813 11.9299242495342 144.327455233507 311.537354629566
 
Tisserand vs w-range in the last quartile
Due to the limited number of TNO, it is not clear to me if these proportions are significant or not:
[2.03,2.41] (2.41,2.75] (2.75,2.98]
[0,90] 1 2 1
(90,180] 2 0 1
(180,270] 0 0 1
(270,360] 2 2 2
 
 
Tisserand vs om-range in the last quartile
[2.03,2.41] (2.41,2.75] (2.75,2.98]
[0,90] 1 1 3
(90,180] 3 1 1
(180,270] 1 1 1
(270,360] 0 1 0
 
Kind Regards,
Alessandro Odasso