60558 Echeclus (2000 EC98) also known as 174P/Echeclus is a centaur that occasionally shows a cometary activity.
Outbursts happened in 2005, 2011 and in the first days of December 2017 (see MPML message from Brian Skiff) and confirmation from Richard Miles and Jean-François Soulier.
The 2017 outburst is the strongest ever witnessed.
I
simulated 100 clones of this centaur in the past 10^8 days trying to
confirm its possible cometary origin: note that I am not taking into account the non gravitational forces associated to its outburst, not clear to me if they have a considerable effect.
The
first step was to generate clones having orbital parameters distributed
around the nominal ones with 1-sigma uncertainty as follows:
JPL Small-Body Database Browser
60558 Echeclus (2000 EC98)
[ show orbit diagram ]
Simulation approach
----------------------
Algorithm: Bulirsch-Stoer (general)
Integration start epoch: 2458000.5000000 days
Integration stop epoch: -100000000.0000000
Output interval: 100.000
Output precision: medium
Initial timestep: 0.050 days
Accuracy parameter: 1.0000E-12
Central mass: 1.0000E+00 solar masses
J_2: 0.0000E+00
J_4: 0.0000E+00
J_6: 0.0000E+00
Ejection distance: 1.0000E+02 AU
Radius of central body: 5.0000E-03 AU
Simulation Results
The time (Year) when they entered the solar system was distributed as follows:
Min. 1st Qu. Median Mean 3rd Qu. Max.
-272080 -109330 -62183 -82802 -36357 -4980
In a graphical form:

A look at the nominal asteroid
The nominal asteroid itself has a cometary origin.
60558 Echeclus (2000 EC98)
| Classification: Centaur SPK-ID: 2060558 |
| [ Ephemeris | Orbit Diagram | Orbital Elements | Physical Parameters | Discovery Circumstances | Close-Approach Data ] |
[ show orbit diagram ]
| Orbital Elements at Epoch 2458000.5 (2017-Sep-04.0) TDB Reference: JPL 85 (heliocentric ecliptic J2000)
| Orbit Determination Parameters
Additional Information
|
Simulation approach
reference:
J.E.Chambers (1999)
A
Hybrid Symplectic Integrator that Permits Close Encounters between
Massive Bodies''. Monthly Notices of the Royal Astronomical Society, vol
304, pp793-799.
Integration parameters----------------------
Algorithm: Bulirsch-Stoer (general)
Integration start epoch: 2458000.5000000 days
Integration stop epoch: -100000000.0000000
Output interval: 100.000
Output precision: medium
Initial timestep: 0.050 days
Accuracy parameter: 1.0000E-12
Central mass: 1.0000E+00 solar masses
J_2: 0.0000E+00
J_4: 0.0000E+00
J_6: 0.0000E+00
Ejection distance: 1.0000E+02 AU
Radius of central body: 5.0000E-03 AU
Simulation Results
- 77 out of 100 clones have a cometary orbit (i.e. they came from a distance greater than 100 AU).
- of which: 3 came on a hyperbolic orbit. The one that had the highest speed had a Vinfinity about 3.7 km/s (Vinfinity = 42.1219*sqrt(-0.5/a) --> the semi-major axis being about -63.6 AU
The time (Year) when they entered the solar system was distributed as follows:
Min. 1st Qu. Median Mean 3rd Qu. Max.
-272080 -109330 -62183 -82802 -36357 -4980
In a graphical form:

A look at the nominal asteroid
The nominal asteroid itself has a cometary origin.
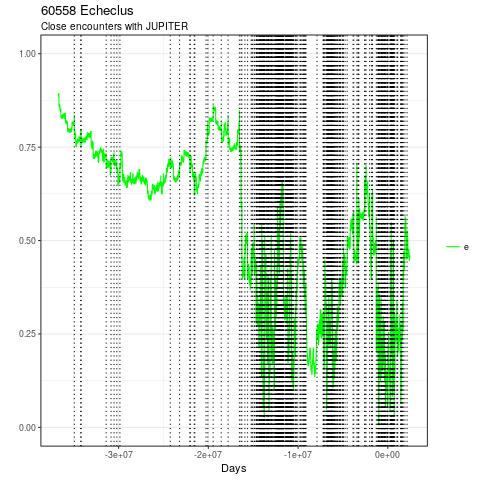
It entered into the solar system at about year -105000 B.C.
In the plot below, the dashed vertical lines correspond to a close approach with Jupiter.


Note that Jupiter was not immediately important.
In its early history, 174P/Echeclus was much more influenced by Saturn as shown here:

Coming back to plots showing the role of Jupiter, we can see these other ones:


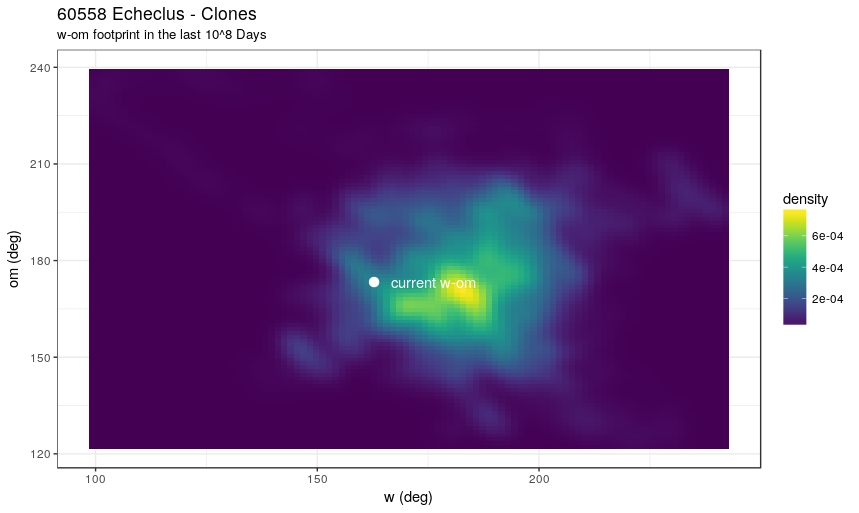
A look at the clones - "footprint" diagrams
At
any given time in the past, a clone had a certain perihelium q and a
certain aphelium Q (I disregard the clones when on an hyperbolic
trajectory because Q would be infinite).
Let's
imagine that we plot all possible q-Q points in a diagram: the highest
density area is the one where the clones happened to be for most of the
time.
This is shown here ( I have used the R function stat_density2d - color scale implemented by viridis library):


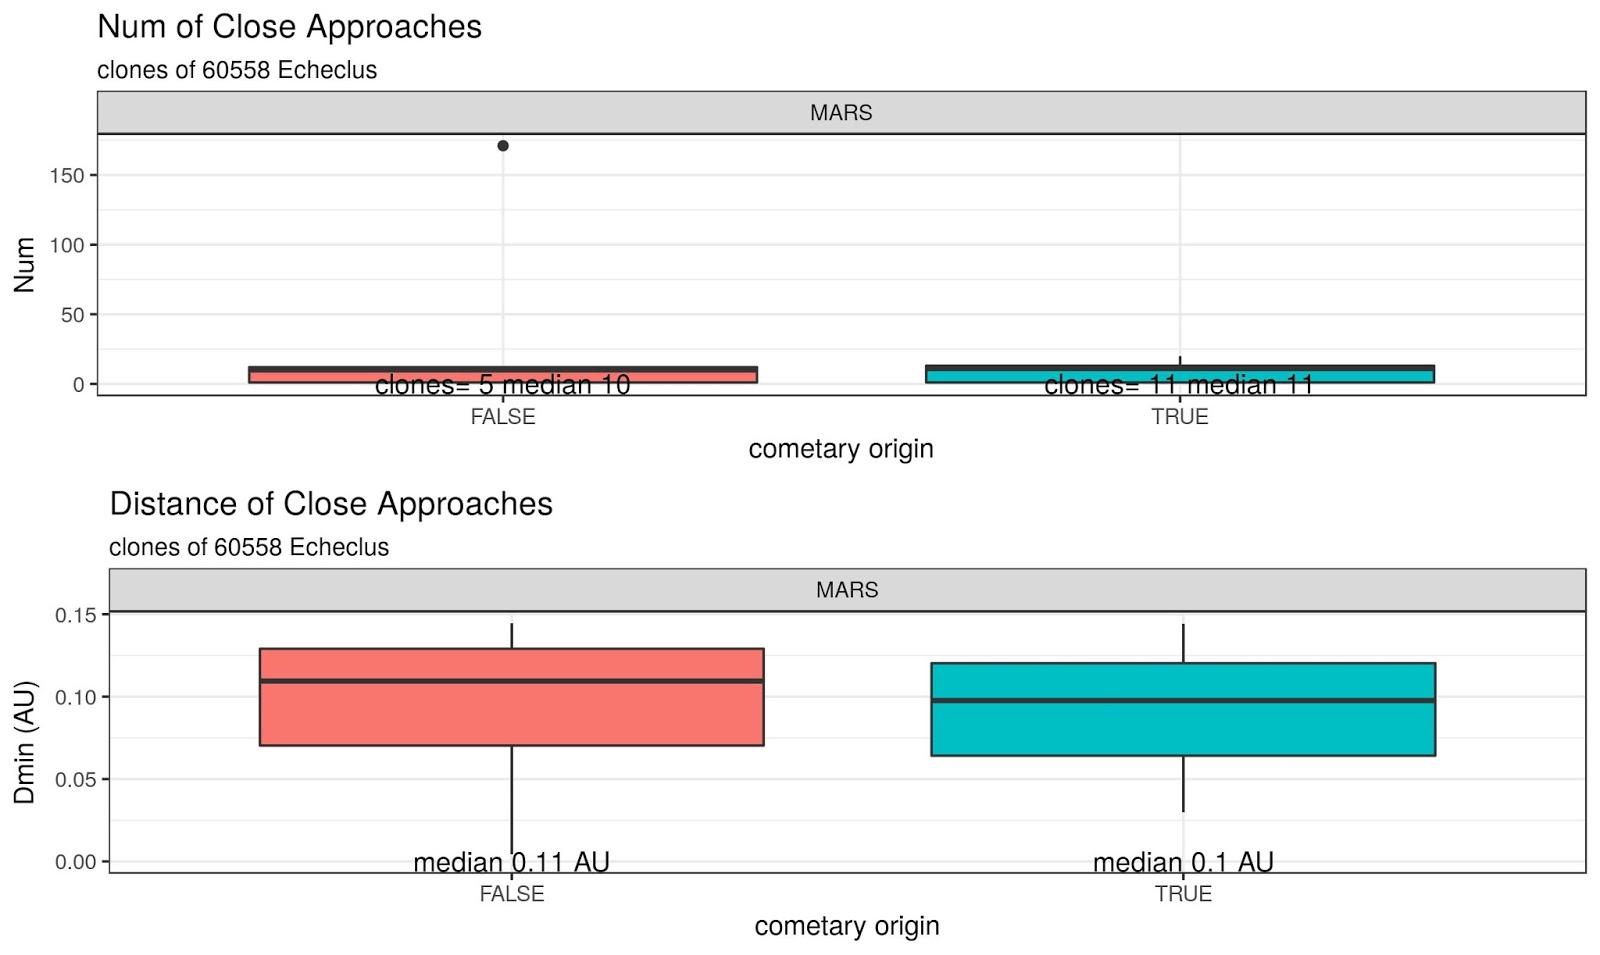
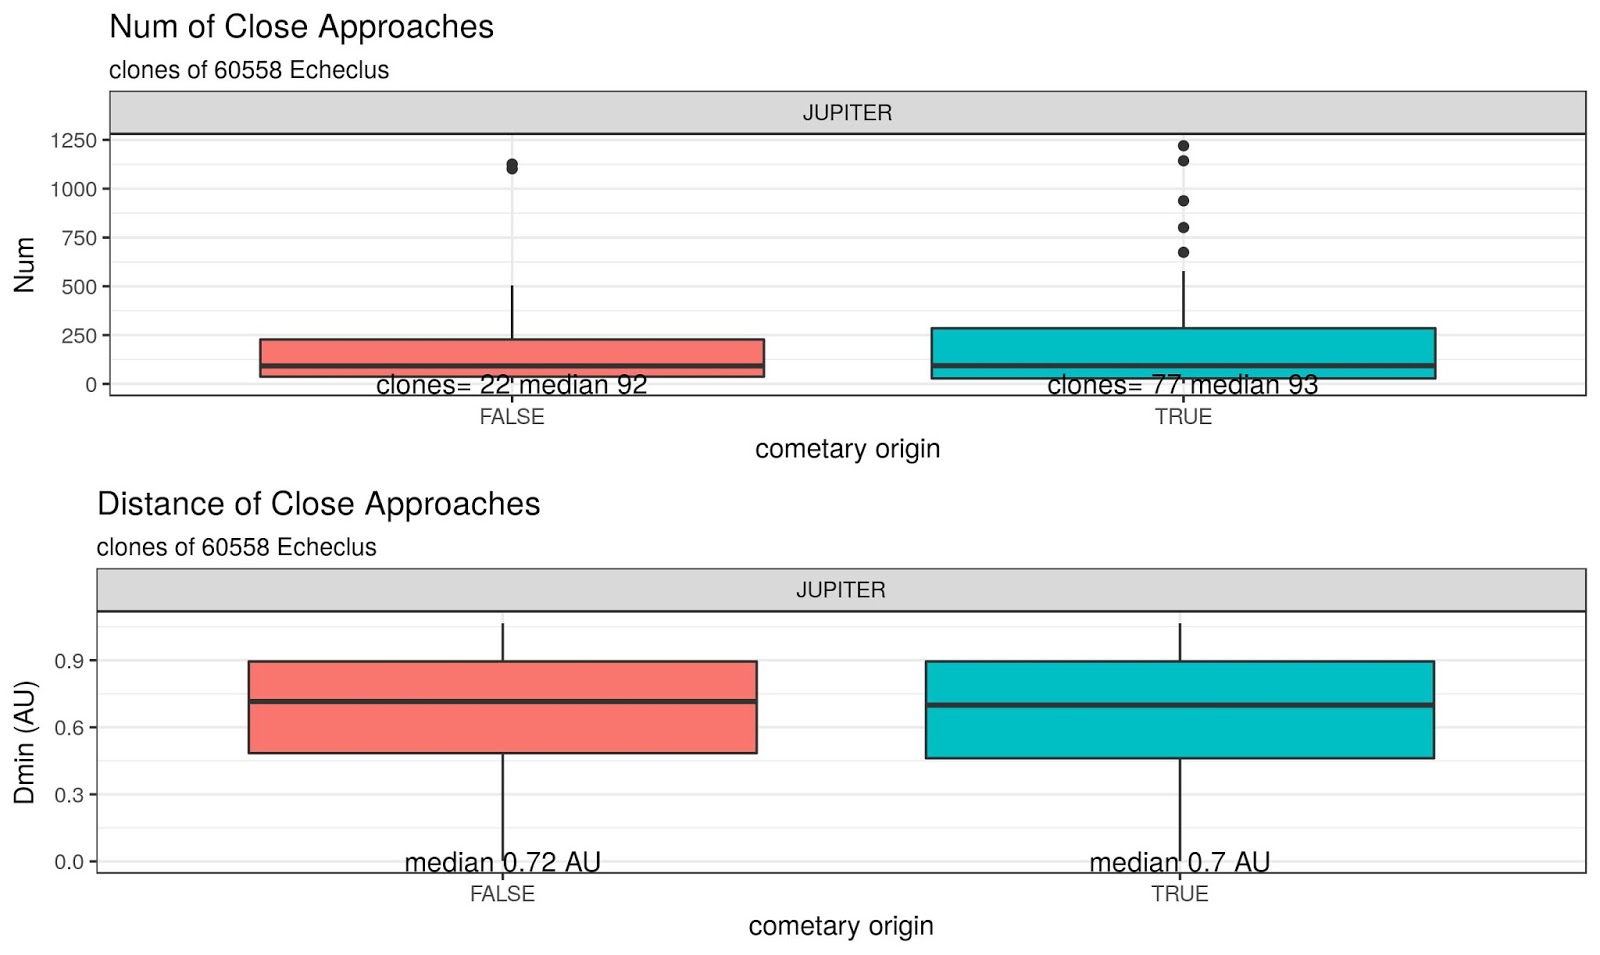
These plots show the distribution of close appproaches (number and Dmin distance) between the clones and the major planets.


Alessandro Odasso
No comments:
Post a Comment
Note: Only a member of this blog may post a comment.