The Minor Planet Center maintains an updated list of Jupiter Trojans (last updated on 2020 Dec. 8).
After some "cut&paste", I managed to read that list in an R dataframe.
Here you can see some lines:
> head(p)
Ln q Q H M Peri. Node Incl. e a
1906 TG L4 4.443 5.976 8.27 271.74 133.3 316.5 10.3 0.147 5.209
1906 VY L5 4.490 5.939 8.24 237.01 307.9 44.3 22.1 0.139 5.215
1907 XM L4 5.142 5.382 7.28 202.51 184.2 342.8 18.2 0.023 5.262
1908 CS L4 4.558 5.771 8.71 14.90 343.5 350.7 4.5 0.117 5.164
1917 CQ L5 4.544 5.822 8.71 324.73 335.5 301.6 8.9 0.123 5.183
1919 FD L4 4.927 5.629 7.93 301.43 80.6 338.0 21.8 0.067 5.278
In the above data frame, I managed to give the relevant asteroid provisional designation to each row name.
The second column Ln represents the lagrangian point, either L4 or L5.
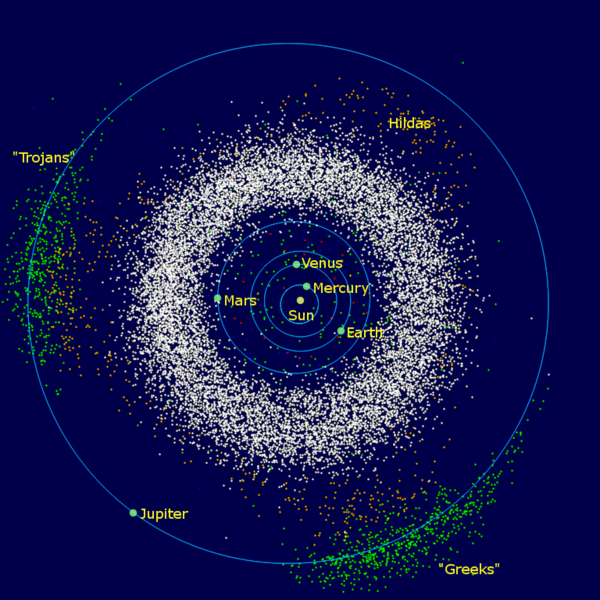
In fact, the Trojan asteroids are divided into two groups:
- the so called "Greek group" is located around L4 (ahead of Jupyter)
- the so called "Trojan group" is located around L5 (trailing Jupyter)
I found a nice wikipedia picture showing their relative location with respect to Jupyter.
Out of curiosity - probably just to find well known asteroid properties - I tried a few exercizes in R.
First of all, I checked if the MPC list was loaded correctly in R, counting the number of asteroids in the above two groups:
> summary(p$Ln)
L4 L5
5651 3421
This is ok, in fact the same numbers are reported in the MPC list.
We can also give a look at the overall statistics.
Just to make it easier to read, I divide it in a few parts :
> summary(p[,c(2:4)])
q Q H
Min. :3.577 Min. :5.069 Min. : 7.28
1st Qu.:4.708 1st Qu.:5.426 1st Qu.:13.22
Median :4.850 Median :5.557 Median :13.90
Mean :4.825 Mean :5.580 Mean :13.65
3rd Qu.:4.980 3rd Qu.:5.698 3rd Qu.:14.30
Max. :5.328 Max. :6.753 Max. :18.50
NA's :1
Note that the H has one NA value: in fact, in the case of (2010 GE) the H value is not available .
> summary(p[,c(5:7)])
M Peri. Node
Min. : 0.0 Min. : 0.00 Min. : 0.00
1st Qu.:210.1 1st Qu.: 89.78 1st Qu.: 88.95
Median :272.3 Median :179.50 Median :169.65
Mean :240.8 Mean :179.89 Mean :173.14
3rd Qu.:310.4 3rd Qu.:271.60 3rd Qu.:256.10
Max. :360.0 Max. :360.00 Max. :360.00
> summary(p[,c(8:10)])
Incl. e a
Min. : 0.10 Min. :0.00100 Min. :4.952
1st Qu.: 7.10 1st Qu.:0.04400 1st Qu.:5.165
Median :11.30 Median :0.06700 Median :5.204
Mean :13.69 Mean :0.07255 Mean :5.203
3rd Qu.:19.20 3rd Qu.:0.09300 3rd Qu.:5.243
Max. :57.20 Max. :0.29800 Max. :5.419
Let's now compare the Greek and the Trojan groups to see if we can find a significant difference between their parameters.
I feel that for this analysis it is better to use a graphical approach.
This is done in R thanks to the wonderful "ggplot2" package by H. Wickham.
For example, we can look at the distribution using a "box-plot" (showing quartiles plus min and max values).
Let's start with H mag:
H Mag

There is no significant difference between the two groups even though there might be a couple of asteroid in the L4 group that are brighter than those in the L5 group and the opposite might also hold ... (but here I am probably reading too much).
Similarly, we can do the same analysis for the orbital parameters.
Perihelium

Aphelium

No significant difference till now.
Mean Anomaly
Let's see the distribution of mean anomaly M:

In this case one might doubt that a small difference exists (L5 median seems less than L4 median), however, a t test shows that this is not the case. In fact, the p-value is greater that 0.05 (95% confidence level) so we have no reason to reject the null hypothesis.
> t.test(M~Ln,p)
Welch Two Sample t-test
data: M by Ln
t = 1.5564, df = 7797.9, p-value = 0.1197
alternative hypothesis: true difference in means is not equal to 0
95 percent confidence interval:
-0.8426388 7.3362908
sample estimates:
mean in group L4 mean in group L5
242.0441 238.7973
One curious fact: the distribution for M, for both L4 and L5 groups, has two maxima - nor clear why and whether this is noteworthy or not:

We can continue our analysis with the other parameters ...
Argument of Perihelium

Ascending Node

Again, here we might have the impression that there is slight difference in the mean value of Node.
Let' see if this is really significant:
> t.test(Node~Ln,p)
Welch Two Sample t-test
data: Node by Ln
t = 3.8699, df = 7360.8, p-value = 0.0001098
alternative hypothesis: true difference in means is not equal to 0
95 percent confidence interval:
4.14388 12.65160
sample estimates:
mean in group L4 mean in group L5
176.3043 167.9066
Apparently yes!, looking at the p-value we should reject the null hypothesis and accept the alternative one that states that true difference in means for the Ascending Node is not equal to 0 and in fact its true value lies between about 4 and 12 degrees.
However, one can say that the above t test is not valid because the distribution has not a nice gaussian shape:

Another curious fact (at least for me!) is found when you take the sum of Peri and Node.
This is the distribution of Node + Peri - there is a second relative maximum.

One can also note that
the curves are almost symmetrical when compared to the black vertical line
that shows the (Node+Peri) value for the planet Jupyter and this is just
the consequence of being around L4 and L5:
Lookinfg at the above graph, as Node+Peri increasis, we see first a prevalence of L4 then L5 and after L4 and L5. Another way to see this:

Let's now look at Inclination:
Inclination

Here the t test shows this:
> t.test(Incl.~Ln,p)
Welch Two Sample t-test
data: Incl. by Ln
t = -26.047, df = 6329.1, p-value < 2.2e-16
alternative hypothesis: true difference in means is not equal to 0
95 percent confidence interval:
-5.157120 -4.435177
sample estimates:
mean in group L4 mean in group L5
11.87947 16.67562
So the difference in Inclination seems to be really significant.
Looking at the p-value we should reject the null hypothesis and accept the alternative one that states that true difference in means for the Inclination is not equal to 0 and in fact its true value lies between about 4.4 and 5.1 degrees.
Again, this is not necessarily true because the distribution does not have a nice gaussian shape ... but it is true that the two distribution are different:

Let's now look at semi-major axis and eccentricity:
Semi-major axis

Eccentricity

In conclusion, for semi-major axis and eccentricity there seems to be no significant difference between the Greeks and the Trojans.
However, for both groups, the eccentricity distribution seems to be a little skewed:

OneR Rule
Another "game" that we can play: let's imagine that we are given a trojan but do not know if it belongs to the "Greek" camp or the "Trojan" camp.
We want to see if the algorithm OneR can find one decision rule based on the orbital parameters.
library(oneR)
data <- optbin(Ln~.,data=p)
model <- OneR(data, verbose = TRUE)
the result is:
> summary(model)
Call:
OneR.data.frame(x = data, verbose = TRUE)
Rules:
If Incl. = (0.0429,16.7] then Ln = L4
If Incl. = (16.7,57.3] then Ln = L5
Accuracy:
5921 of 9071 instances classified correctly (65.27%)
Contingency table:
Incl.
Ln (0.0429,16.7] (16.7,57.3] Sum
L4 * 4334 1317 5651
L5 1833 * 1587 3420
Sum 6167 2904 9071
---
Maximum in each column: '*'
Pearson's Chi-squared test:
X-squared = 521.19, df = 1, p-value < 2.2e-16
So the oneR chooses Inclination as the best parameter capable to make the decision but the accuracy is only 65%
We can give a little help to the system by adding a new column np=Node+Peri and see if the agorithm is capable to find a better rule (this time, we subtract 360 when the angle is greater than 360).
The answer is positive, the accuracy of the new rule has been increased to about 80%
> summary(model)
Call:
OneR.data.frame(x = data, verbose = TRUE)
Rules:
If np = (-0.36,225] then Ln = L4
If np = (225,360] then Ln = L5
Accuracy:
7218 of 9071 instances classified correctly (79.57%)
Contingency table:
np
Ln (-0.36,225] (225,360] Sum
L4 * 4812 839 5651
L5 1014 * 2406 3420
Sum 5826 3245 9071
---
Maximum in each column: '*'
Pearson's Chi-squared test:
X-squared = 2854.3, df = 1, p-value < 2.2e-16
Kind Regards,
Alessandro Odasso


