Blog Archive

Sunday, November 15, 2015

2002 UP11 vs 2015 VF105

See update about this case:
https://groups.yahoo.com/neo/groups/mpml/conversations/messages/31516

=================================
2002 UP11 and 2015 VF105 have similar orbit parameters.
The uncertainty for 2015 VF105 is unknown and I do not find its observations.


Using the Mercury software, it seems that they had a relative close approach on May 8th, 2001 when their nominal relative distance and velocity were:
  • distance 0.00147 AU
  • velocity: ca 5 m/s
Maybe in the future, when further observations will be available, it will be possible to study them looking for a common origin

JPL Small-Body Database Browser:


(2002 UP11)
Classification: Mars-crossing Asteroid          SPK-ID: 3224224
Ephemeris | Orbit Diagram | Orbital Elements | Physical Parameters ]

[ show orbit diagram ]

Orbital Elements at Epoch 2457200.5 (2015-Jun-27.0) TDB
Reference: JPL 2 (heliocentric ecliptic J2000)
 Element Value Uncertainty (1-sigma)   Units 
e .382955379120253 0.00010057
a 2.187589320416579 0.00042822 AU
q 1.349840222857032 4.6502e-05 AU
i 22.87063099452443 0.0044292 deg
node 43.70403288617293 0.0014051 deg
peri 62.82185003664876 0.00090087 deg
M 293.5443079306065 0.40392 deg
tp 2457418.660842947343
(2016-Jan-31.16084295)
1.39 JED
period 1181.808525581734
3.24
0.34701
0.0009501
d
yr
n .3046178735449497 8.9443e-05 deg/d
Q 3.025338417976127 0.0005922 AU
Orbit Determination Parameters
   # obs. used (total)      17  
   data-arc span      49 days  
   first obs. used      2002-10-04  
   last obs. used      2002-11-22  
   planetary ephem.      DE431  
   SB-pert. ephem.      SB431-BIG16  
   condition code      6  
   fit RMS      .53879  
   data source      ORB  
   producer      Otto Matic  
   solution date      2014-Jun-13 03:11:31  

Additional Information
 Earth MOID = .485591 AU 
 T_jup = 3.482 


(2015 VF105)
Classification: Mars-crossing Asteroid          SPK-ID: 3734494
Ephemeris | Orbit Diagram | Orbital Elements | Physical Parameters ]

[ show orbit diagram ]

Orbital Elements at Epoch 2457300.5 (2015-Oct-05.0) TDB
Reference: E2015-VE1 (heliocentric ecliptic J2000)
 Element Value Uncertainty (1-sigma)   Units 
e 0.3831181 n/a
a 2.1883016 n/a AU
q 1.3499236 n/a AU
i 22.88002 n/a deg
node 43.69986 n/a deg
peri 62.82823 n/a deg
M 323.14568 n/a deg
tp 2457421.5445051
(2016-Feb-03.04450510)
n/a JED
period 1182.3857240
3.24
n/a
n/a
d
yr
n 0.30446917 n/a deg/d
Q 3.0266796 n/a AU
Orbit Determination Parameters
   # obs. used (total)      21  
   data-arc span      62 days  
   first obs. used      2015-09-11  
   last obs. used      2015-11-12  
   # oppositions      1  
   two-body model      T  
   fit RMS      0.13  
   data source      MPC:mp1  
   producer      MPCW  

Additional Information
 T_jup = 3.482 

Graph


Kind Regards,
Alessandro Odasso

Friday, August 7, 2015

(356713) 2010 GS25 vs 2014 QX220

These two asteroids have similar orbits:
(356713) 2010 GS25
2014 QX220


Mean motion uncertainty a little less than 10^-8 deg/day

I wonder if these two asteroids originated from a common parent body about 10Kyears ago.

Using the Mercury simulator by John Chambers on the nominal parameters, we have this result:


Year -8168
Distance = 0.0000232 (AU) about 3500 km
Relative Velocity = 7.270e-08 (AU/Day) about 12 cm/s


Kind Regards,
Alessandro Odasso

Saturday, July 18, 2015

Question about divorced asteroid pairs orbit stability

I refer to the list of most recently potentially divorced binary pairs found by Robert D, Matson.

I used JPL Horizons Web Interface to get the orbital data for (63440) 2001 MD30 and (331933) 2004 TV14

Then, I used the Mercury simulator to look at their past and future orbits and I used the R package to plot the results:

Let's look at the past:

Let's now look at the future:

I do not know if it is common for two divorced asteroid pairs to continue to stay on a very similar orbit. At least in this case, these asteroids will come again very very near. 

Not clear if this is a proof of the fact that they are a divorced pair or this is just a nice example of two asteroids that have nothing to do but are by chance on a (almost) collision orbit.

The nominal result for the event "minimum distance" is:
  • date: 25-May-5418
  • minimum distance : 8.95e-06 (AU) ... just about 1300 km
  • relative velocity:       2.16e-07 ( AU/day ) ... just about 0.37 m/s

uncertainty error : unknown


Kind Regards,
Alessandro Odasso

Saturday, June 13, 2015

Asteroids with high perihelion precession rates

As described in this MPML message, an interesting study is under way: its goal is to
measure the perihelion precession rates for a number of objects to quantify the effects of general relativity (GR) and solar oblateness.


More at http://mel.epss.ucla.edu/jlm/research/NEAs/GR/


Based on this list, we can get the following data:

SymbolDescription
HAbsolute magnitude
aSemi-major axis (au)
eEccentricity
iInclination (deg)
POrbital period (days)
SLRSemilatus rectum (au)
drRange rate due to GR/J2 (km/y)
dwPerihelion shift (asec/century)
arcLength of optical arc
nobsNumber of optical observations
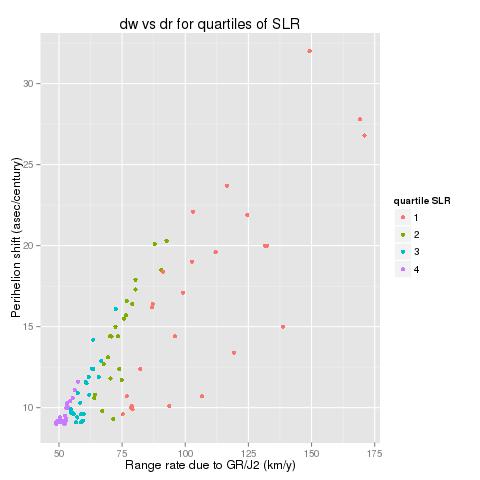
Let's visually see how SLR, dr and dw are related:

  • Graph 1 - dw vs SLR (parameter = quartile of dr)

  • Graph 2 - dw vs dr (parameter = quartile of SLR) 


Graph 1 - dw vs SLR (parameter = quartile of dr)

> quantile of dr (km/y)
     0%     25%     50%     75%    100% 
 48.800  55.425  66.300  80.300 171.000 


Graph 2 - dw vs dr (parameter = quartile of SLR)

> quantileof SLR (au)
     0%     25%     50%     75%    100% 
0.17400 0.37400 0.48550 0.58675 0.66400


It seems to me that both graphs show (as expected) that the more an asteroid comes near the sun the more important is the dr effect.
The same is true for the dw effect but I do not understand this:
  • dw belongs to an area defined by two almost linear boundaries (the slope of the higher boundary is greater than the slope of the lower boundary , thus we see a "triangular shape"...)
    Why does this happen?


Multiple regression

Coming back to easier considerations, there may be another way to show the relation between dw, dr and SLR.
Look at the multiple regression fit that predicts dw based on SLR and dr taking into
account the interaction between SLR and dr:

> summary(fit)

Call:
lm(formula = dw ~ SLR * dr, data = p)

Residuals:
     Min       1Q   Median       3Q      Max 
-2.15438 -0.30660  0.04085  0.24131  3.13628 

Coefficients:
              Estimate Std. Error t value Pr(>|t|)    
(Intercept) -27.820350   0.981042 -28.358  < 2e-16 ***
SLR          -6.124334   1.318151  -4.646 1.15e-05 ***
dr            0.146494   0.006126  23.912  < 2e-16 ***
SLR:dr        1.038595   0.028026  37.059  < 2e-16 ***
---
Signif. codes:  0 ‘***’ 0.001 ‘**’ 0.01 ‘*’ 0.05 ‘.’ 0.1 ‘ ’ 1

Residual standard error: 0.5601 on 90 degrees of freedom
Multiple R-squared:  0.9863, Adjusted R-squared:  0.9859 
F-statistic:  2163 on 3 and 90 DF,  p-value: < 2.2e-16


dw - Fitted values vs original values


This is the normal probability plot used to see how much the residuals of the model are
normally distributed:


Kind regards,
Alessandro Odasso

Tuesday, June 9, 2015

Near Earth Asteroids - Low Delta-V - Frame of reference co-rotating with earth

Due to their earth like orbit, these low delta-v asteroids move slowly when seen from earth. The resulting movement is very nice.

I tried to visualize asteroids which are likely to be lunar ejecta. I also add Bennu that moves much faster but it is interesting to see how it gets "near" to the earth during the Osiris-REx mission 

All the other asteroids are sorted by Delta-V.
The last two asteroids have a very low eccentricity.

The following graphs show their movement in the next 10 years:
  • Sun is at (0,0)
  • Earth is at about (1,0)

Bennu
a-e-i
1.126  0.204    6.0 
 
2006RH120
a-e-i 
1.033  0.024    0.6

2012TF79
a-e-i
1.050  0.038    1.0

2009BD
a-e-i 
1.062  0.052    1.3

2014WX202
a-e-i 
1.035  0.059    0.4

1991VG
a-e-i 
1.027  0.049    1.4

2013RZ53 (maybe artificial, though not very likely: see this link)
a-e-i
1.013  0.027    2.1


2014WA366
a-e-i 
1.034  0.071    1.6

2014WU200
a-e-i 
1.027  0.072    1.3

2015JD3
a-e-i 
1.058  0.008    2.7

2014TW
a-e-i 
1.029  0.009    9.0


Kind Regards,
Alessandro Odasso

Sunday, May 31, 2015

Near-Earth Asteroid Delta-V


JPL maintains an interesting list: Near-Earth Asteroid Delta-V for Spacecraft Rendezvous

Let's display how Delta-V depends on perihelium q=a*(1-e)

(Graphs are done with  R package and the related ggplot function)

Neo with q <=1
Delta-V (km/s) vs q (AU)
The red line is a very rough approximation for the lower boundary of Delta-V (km/s) as a function of q (AU):

delta-v = -7.3q + 11.4 when q<=1

Neo with q> 1
Delta-V (km/s) vs q (AU)

The red line is a very rough approximation for the lower boundary of Delta-V (km/s) as a function of q (AU):

delta-v = 4.6q - 0.5 when q>1

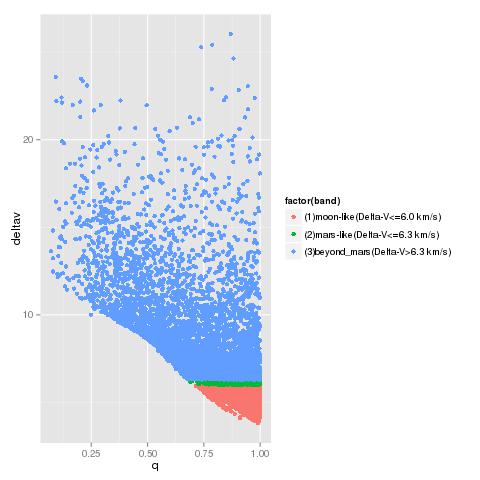
Three "bands" for Delta-V
As stated in the JPL page, for comparison, Delta-V for transferring from Low Earth Orbit to rendezvous with Moon and Mars:
  • Moon: 6.0 km/s
  • Mars: 6.3 km/s
Thus, we can graphically display three bands for Delta-V. I call them as follows:
1) moon-like (Delta-V <= 6.0 km/s)
2) mars-like (Delta-V <= 6.3 km/s)
3) beyond-mars (Delta-V > 6.3 km/s)

Neo with q <=1
Delta-V (km/s) vs q (AU)

Neo with q > 1

Delta-V (km/s) vs q (AU)


We can look at the neo distribution in every Delta-V band:

Neo with q <=1

Neo with q >1
Ultra-low Delta-V Neo
I often read that these neo are considered as a particular interesting target for   spacecraft rendezvous missions because very little energy is needed to reach them.

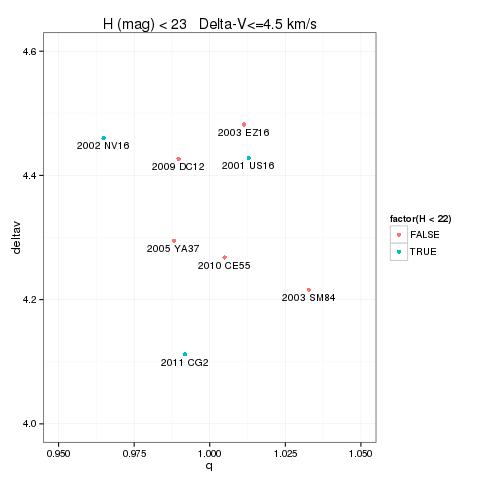
This is a graphical display for neo with Delta-V <= 4.5 km/s:
These ultra low Delta-V neo are just a tiny fraction of the neo population.
This is their proportion:
As known, one of the problems with these neo is that it is very difficult to find relative bright (and thus big) asteroids.

The graph below shows all the ultra low Delta-V asteroids with H (mag) <= 23 showing that only three neo of this group have H (mag) <= 22. They are:

Designation Delta-V (km/s) H (mag)

2011 CG2

4.112

21.5

2001 US16

4.428

20.2

2002 NV16

4.460

21.4

(1999 RQ36) Bennu and ("similar?") Neo

Delta-V for Bennu: 5.087 km/s
H (mag) = 20.9

See also:
http://en.wikipedia.org/wiki/101955_Bennu
http://astro.mff.cuni.cz/davok/papers/bennu_osiris_maps2015.pdf

If we give a look at asteroids having Delta-V and H at least comparable (or better) than those of asteroid Bennu, target of the OSIRIS-REx mission, we can find a few other ones.
Bennu is shown at the top-left corner of the image.
Of course, Delta-V is not the only parameter used to decide whether an asteroid is a good candidate for a sample return mission (physical characteristics, a well known orbit and an appropriate rendezvous time are certainly other fundamental aspects!). 
Once said this, I would be interested to know if some of the other asteroids shown here are candidates for similar missions.
In fact, I found an interesting link showing the earth-centric orbit view of many of these asteroids


Kind Regards,
Alessandro Odasso

Friday, May 1, 2015

Asteroid Spectral Type Distribution up to 1st Kirkwood gap

I would like to analyze the relation between asteroid spectral types and photometric data.

MPC has made available an interesting web service to download data from their databases.

Data Acquisition
The web service can be accessed running a powerful Python script that return a lot of asteroids' physical and orbital parameters (more than 100 columns!).

The first python query that I used to extract the list of asteroids was like this:

python mpc-fetch.py order_by semimajor_axis taxonomy_class_min A semimajor_axis_min 0 > part1.xml

This syntax allows you to get all asteroids belonging to taxonomy class A, B, C etc. without having to bother for those that are not yet classified.
The web service limits the output to 16384 asteroids so I had to look at the last xml section, I read the last semimajor_axis value and then I submitted the second query:

python mpc-fetch.py order_by semimajor_axis taxonomy_class_min A semimajor_axis_min 2.2179251 >> part2.xml

Then I repeated the process and I run:

python mpc-fetch.py order_by semimajor_axis taxonomy_class_min A semimajor_axis_min 2.2718021 >> part3.xml

... and so on, till I reached semimajor_axis about 2.5 au where I stopped: no reason to choose this value, I chose it just to limit the number of queries (although, the threshold of 2.5 au is also nice because this is the first big Kirkwood gap).

After that, I had to convert the XML file (quite big: about 131000 ateroids) in a CSV file.

I used another python utility called xml2csv as follows (for every single file):

xml2csv --input part1.xml --output part1.csv --tag property

Finally, I concatenated all CSV files together.

Data Analysis
I used a data mining package called Weka developed by the University of Waikato in New Zealand.

The distribution of asteroids is like this:

Within a set of 131072 asteroids, we can easily see the top three groups:
  • Nr. of S type - 111565
  • Nr. of C type - 13207 
  • Nr. of E type - 5671

Let's see how we can recognize these three groups based on some physical parameters chosen among color indexes.
 
First of all I used the "Select Attribute" tool to rank the list of the most important parameters (among color indexes) that can be used to predict the taxonomy class.
This is the result:

Panstarrs parameters are on top of the list, almost all with the same average merit.
It is nice to visually show why.

Panstarrs parameter distribution
These graphs, made with the ggplot2 tool of the R package, confirm that the panstarrs parameters allow to discriminate between S-type, C-type and E-type asteroids.
In fact, every single distribution is constituted mostly of asteroids belonging to the same taxonomy class.

We can also visually display the covariance matrix as a "heatmap".
I found a very interesting link that explains how to do this:
ggplot2 : Quick correlation matrix heatmap - R software and data visualization

This is the result:


Finally, let's go back to Weka and perform:
  • cluster alanysis
  • logistic model

Cluster Analysis
I run a K-means clustering algorithm with K=3:
  • The S-type asteroids were associated to cluster 0
  • The C-type asteroids were associated to cluster 1
  • The E-type asteroids were associated to cluster 2
  • All different types were mainly attributed to cluster 0 with the exception of V-type that were grouped in the same clusters of E-type asteroids. Cluster 1 is entirely constituted of C-Type asteroids.
The clustering schema in this case is powerful: in fact only 0.48% of the asteroids were incorrectly clustered:


The three cluster centroids are as follows:


The Weka Logistic model
First of all, we must establish a performance boundary about what we expect to get (ZeroR model).
There are 111565 S-type asteroid in a set of 131072 asteroids: the accuracy of any "true" model must be much better that 85%.

After running the logistic model with a N=10 cross-validation, I got these results:


As expected, very good performance not only for S-type asteroids but also C-type asteroids (precision and recall = 1) and E-type asteroids (precision=0.928, recall=1) -  but failure to predict the other less numerous types.


Kind Regards,
Alessandro Odasso