As described in this paper by C. de la Fuente Marcos and R. de la Fuente Marcos, TNO 2004 VB131 and 2003 UT291 are probably dynamically correlated.
I wonder whether TNO 2004 VV131 can be regarded as a third member of a cluster or it just happens to share similar orbital parameters with 2004 VB131 by chance.
The following simulation has been done using Mercury Integrator (package version 6) by John E. Chambers.
reference:
``A Hybrid
Symplectic Integrator that Permits Close Encounters between
Massive Bodies''. Monthly Notices of the Royal Astronomical
Society, vol 304, pp793-799.
The graphs have been done using scripts written in language R, library ggplot2.
Nominal orbits from JPL
| [ Ephemeris | Orbit Diagram | Orbital Elements | Physical Parameters ] |
[ show orbit diagram ]
| Orbital Elements at Epoch 2458600.5 (2019-Apr-27.0) TDB Reference: JPL 6 (heliocentric ecliptic J2000)
| Orbit Determination Parameters
Additional Information
|
| (2003 UT291) |
| Classification: TransNeptunian Object SPK-ID: 3170250 |
| [ Ephemeris | Orbit Diagram | Orbital Elements | Physical Parameters ] |
[ show orbit diagram ]
| Orbital Elements at Epoch 2458600.5 (2019-Apr-27.0) TDB Reference: JPL 7 (heliocentric ecliptic J2000)
| Orbit Determination Parameters
Additional Information
|
| (2004 VB131) |
| Classification: TransNeptunian Object SPK-ID: 3564172 |
| [ Ephemeris | Orbit Diagram | Orbital Elements | Physical Parameters ] |
[ show orbit diagram ]
| Orbital Elements at Epoch 2458600.5 (2019-Apr-27.0) TDB Reference: JPL 1 (heliocentric ecliptic J2000)
| Orbit Determination Parameters
Additional Information
|
| (2004 VV131) |
| Classification: TransNeptunian Object SPK-ID: 3836183 |
I generated 100 clones trying to achieve the same orbital distribution as shown above (average and uncertainty) under the ideal assumption that we can deal with normal distributions.
2004 VB131
| Clones | Target | ||||
|---|---|---|---|---|---|
| mean | sd | mean | sd | ||
| q | 40.6321499 | 0.02750148 | 40.63041372 | 0.027328 | |
| e | 0.07649604 | 0.00019764 | 0.07651699 | 0.0001976 | |
| i | 1.74731535 | 0.00056535 | 1.74733185 | 0.00056088 | |
| peri | 206.91266172 | 0.43573354 | 206.91349565 | 0.43421 | |
| node | 50.37912644 | 0.00333604 | 50.37887944 | 0.0033254 | |
| tp | 2413189.25460454 | 115.05970535 | 2413191.13742622 | 114.82 | |
2004 VV131
| Clones | Target | ||||
|---|---|---|---|---|---|
| mean | sd | mean | sd | ||
| q | 40.64866623 | 0.0090227 | 40.64692423 | 0.0088412 | |
| e | 0.07646112 | 0.00011592 | 0.07647398 | 0.00011666 | |
| i | 1.74668055 | 0.00023669 | 1.74663853 | 0.00023322 | |
| peri | 207.22233167 | 0.09641847 | 207.20729885 | 0.097721 | |
| node | 50.38334862 | 0.00078214 | 50.38338268 | 0.00077942 | |
| tp | 2413270.69430322 | 31.7570317 | 2413267.53432214 | 32.533 | |
Simulation set-up
N-Body algorithm: Bulirsch-Stoer
integration in the last 500 years
output every 100 days
Simulation results
The
resulting 100*100 pairs of clones were analyzed looking for the time
when they reached the minimum distance (taking note of relative velocity
as well).
The best clone couple behaved as shown below
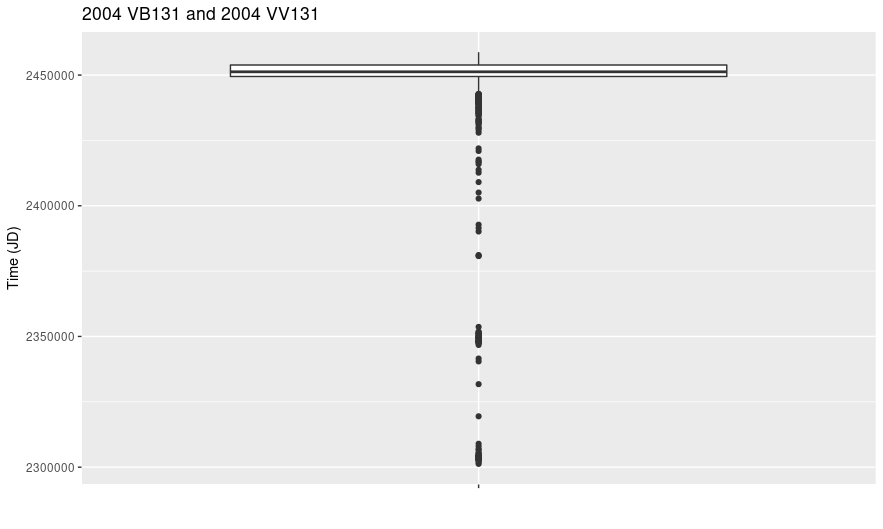
The whole distribution of mininum distances, relative velocities and time was as shown below:
Kind Regards,
Alessandro Odasso


