This is an interesting asteroid discovered by the Morocco Oukaimeden Sky Survey on Dec. 21, 2017
This asteroid is an Apollo and PHA and immediately following its discovery it was suspected to have a cometary origin.
This asteroid is an Apollo and PHA and immediately following its discovery it was suspected to have a cometary origin.
In June 2018, observations from NASA's Goldstone Solar System Radar showed that the asteroid could be a binary system and this was confirmed by the Arecibo Observatory in Puerto Rico and the Green Bank Observatory in West Virginia.
There are two questions:
There are two questions:
- how likely is this object to have a cometary origin based solely on its current orbital parameters and uncertainty?
- is its binary nature telling us something about its origin? is it more likely to have a cometary origin or not?
Regarding the cometary origin, as a first step, I read data from JPL Small-Body Database Browser and I generated 100 clones to simulate their behaviour in the last 1e8 JD.
(2017 YE5)
| Classification: Apollo [NEO, PHA] SPK-ID: 3795078 |
| [ Ephemeris | Orbit Diagram | Orbital Elements | Mission Design | Physical Parameters | Close-Approach Data ] |
[ show orbit diagram ]
| Orbital Elements at Epoch 2458200.5 (2018-Mar-23.0) TDB Reference: JPL 38 (heliocentric ecliptic J2000)
| Orbit Determination Parameters
Additional Information
|
Clone generation
I tried to generate clones that have the same orbital parameters (mean and sigma) shown above.
This table summarizes what has been achieved versus the intended nominal target:
| clones_mean | clones_sd | target_mean | target_sd | ||
| q | 0.81710847 | 5.6E-07 | 0.81710844 | 5.6E-07 | |
| e | 0.71027634 | 2.43E-06 | 0.71027649 | 2.43E-06 | |
| i | 6.20978289 | 2.6E−05 | 6.20978387 | 2.6E−05 | |
| peri | 110.76834516 | 3.1E−05 | 110.76834689 | 3.1E−05 | |
| node | 103.96029755 | 1.82E-05 | 103.96029564 | 1.8E−05 | |
| tp | 2458253.38557146 | 3.1E−05 | 2458253.38557422 | 3.1E−05 | |
Simulation Algorithm
Mercury 6 integrator by John Chambers (1999): "A Hybrid Symplectic Integrator that Permits Close Encounters between Massive Bodies''.
Monthly Notices of the Royal Astronomical Society, vol 304, pp793-799.
I used the general Bulirsch-Stoer algorithm with all planets from Mercury to Pluto plus asteroids Ceres, Pallas and Vesta.
I also used as usual an arbitrary threshold of 100 AU as ejection distance from the solar system.
)O+_06 Integration parameters (WARNING: Do not delete this line!!)
) Lines beginning with `)' are ignored.
)---------------------------------------------------------------------
) Important integration parameters:
)---------------------------------------------------------------------
algorithm (MVS, BS, BS2, RADAU, HYBRID etc) = BS
start time (days)= 2458200.5
stop time (days) = -1d8
output interval (days) = 100
timestep (days) = 0.05
accuracy parameter=1.d-12
)---------------------------------------------------------------------
ejection distance (AU)= 100
radius of central body (AU) = 0.005
central mass (solar) = 1.0
Graphic tools
All plots below have been implemented in language R using the package ggplot2.
R Core Team (2018). R: A language and environment for statistical
computing. R Foundation for Statistical Computing, Vienna, Austria.
URL https://www.R-project.org/.
Simulation Results
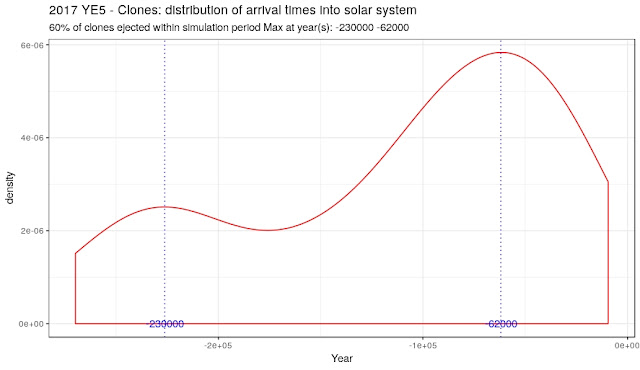
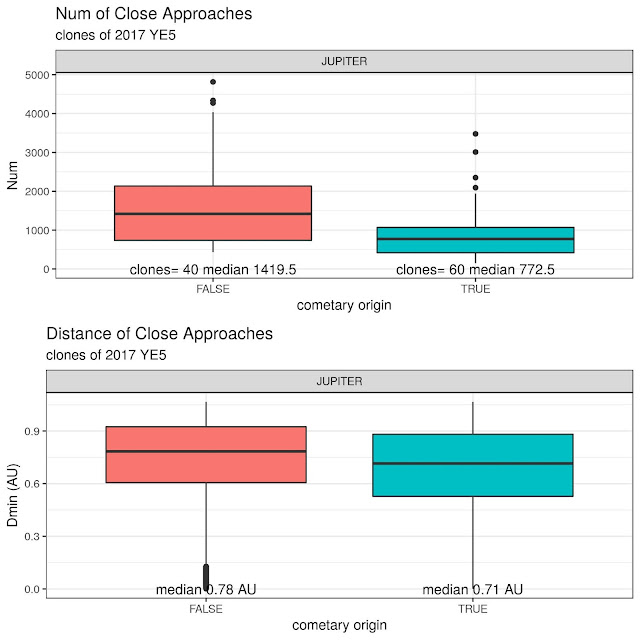
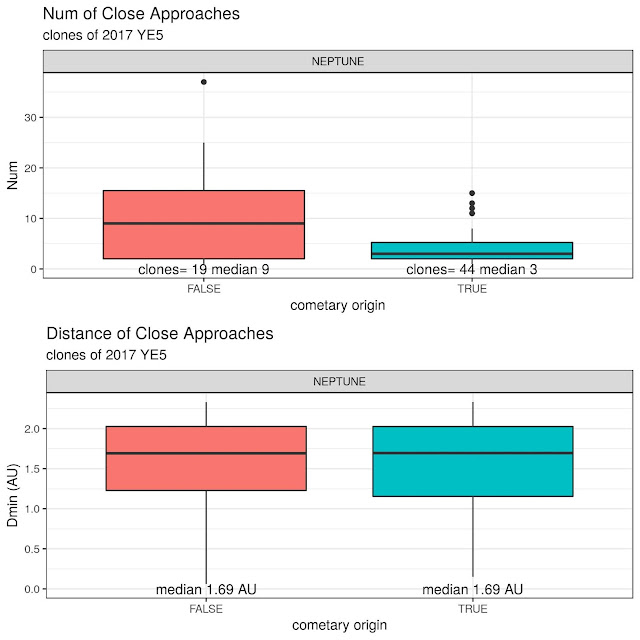
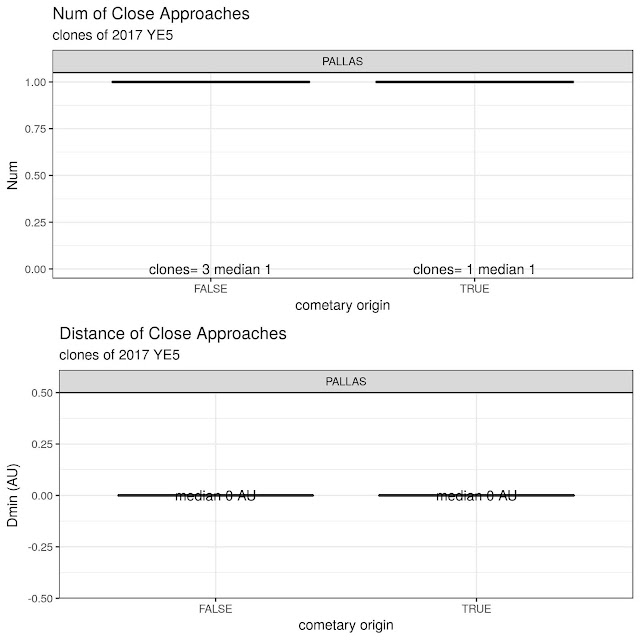
About 60% of the clones were ejected from the solar system in this backward simulation (i.e. they actually came from the outskirt of the solar system and they have a likely cometary origin).
This plot shows that the numer of clones is initially 100 and then as you go back in the past (from right to left) their number is decreasing due to ejection from the solar system:
This second plot below shows the density distribution of the arrival time in the solar system:
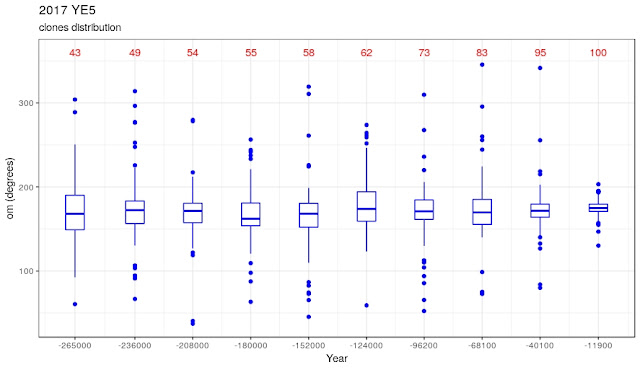
In the following plots the simulation time has been divided into 10 slots and for every slot we show the distribution of the maximum parameter achieved in that time slot by all clones (their number is shown in red):
In the following plots the simulation time has been divided into 10 slots and for every slot we show the distribution of the maximum parameter achieved in that time slot by all clones (their number is shown in red):
Specific Energy
In this plot, by definition, a specific energy greater than 0 means clones travelling on a hyperbolic trajectory:
Footprint q-Q
We can get rid of the temporal dimension and plot the density graph showing where the clones (only those on elliptical orbits) have been most of the time in the plane q-Q:
We can get rid of the temporal dimension and plot the density graph showing where the clones (only those on elliptical orbits) have been most of the time in the plane q-Q:










No comments:
Post a Comment
Note: Only a member of this blog may post a comment.