This post continues from the previous one.
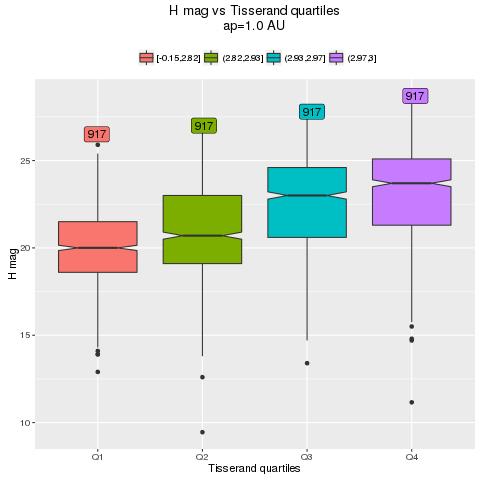
Let's take again the plot H mag vs Tisserand's parameter with respect to Earth (ap=1 AU).
ONLY those Amors with TEarth<3
We have already seen this plot, we just add a few labels to count them:
We have also seen that most of these Amors have also Tisserand's parameter with respect to Jupiter, Venus and Mars < 3 (actually, I refer to it as "Mars" but the exact value for which there was a relative greater correlation between H mag and Tisserand's parameter was ap = 1.65 AU).
A possible question is:how are these asteroids distributed in the various TEarth quartiles?
For graphical purposes, I introduce the following abbreviations:
- Tm = TRUE - Tisserand's parameter with respect to Mercury < 3
- Tv = TRUE - Tisserand's parameter with respect to Venus < 3
- Tma = TRUE - Tisserand's parameter with respect to Mars (better: ap =1.65 aU) < 3
This is the result:
I do not know enough about statistic to say that the above is really significant, but I can give you my feeling.
It seems to me that:
- in TEarth quartile Q2, Q3 and Q4: those Amors having Tma < 3 (red) tend to be brighter than the others not having Tm or Tv < 3 (green)
- in TEarth quartile Q1 and Q2: those Amors having Tma < 3 and Tv < 3 (yellow) tend to be slightly darker than those having only Tma < 3 (red)
- in TEarth quartile Q1: those 79 Amors having Tm<3 (and also Tv and Tma <3) tend to be the brightest.
Below, you can see a table showing the numerosity (as also shown in the labels displayed in the plot) and the median and sd of every group:
Numerosity
> t(tapply(pe$H,list(pe$tsquartile,pe$Tm:pe$Tv:pe$Tma),length))
[-0.15,2.82] (2.82,2.93] (2.93,2.97] (2.97,3]
FALSE:FALSE:FALSE NA 4 33 79
FALSE:FALSE:TRUE 213 871 884 838
FALSE:TRUE:FALSE 1 2 NA NA
FALSE:TRUE:TRUE 624 40 NA NA
TRUE:FALSE:FALSE NA NA NA NA
TRUE:FALSE:TRUE NA NA NA NA
TRUE:TRUE:FALSE NA NA NA NA
TRUE:TRUE:TRUE 79 NA NA NA
[-0.15,2.82] (2.82,2.93] (2.93,2.97] (2.97,3]
FALSE:FALSE:FALSE NA 4 33 79
FALSE:FALSE:TRUE 213 871 884 838
FALSE:TRUE:FALSE 1 2 NA NA
FALSE:TRUE:TRUE 624 40 NA NA
TRUE:FALSE:FALSE NA NA NA NA
TRUE:FALSE:TRUE NA NA NA NA
TRUE:TRUE:FALSE NA NA NA NA
TRUE:TRUE:TRUE 79 NA NA NA
Median
> t(tapply(pe$H,list(pe$tsquartile,pe$Tm:pe$Tv:pe$Tma),median))
[-0.15,2.82] (2.82,2.93] (2.93,2.97] (2.97,3]
FALSE:FALSE:FALSE NA 23.85 24.0 24.6
FALSE:FALSE:TRUE 19.7 20.60 22.9 23.6
FALSE:TRUE:FALSE 23.6 24.15 NA NA
FALSE:TRUE:TRUE 20.1 23.10 NA NA
TRUE:FALSE:FALSE NA NA NA NA
TRUE:FALSE:TRUE NA NA NA NA
TRUE:TRUE:FALSE NA NA NA NA
TRUE:TRUE:TRUE 19.2 NA NA NA
Standard deviation
> t(tapply(pe$H,list(pe$tsquartile,pe$Tm:pe$Tv:pe$Tma),sd))
[-0.15,2.82] (2.82,2.93] (2.93,2.97] (2.97,3]
FALSE:FALSE:FALSE NA 0.9832238 1.984962 2.098781
FALSE:FALSE:TRUE 2.153851 2.4985271 2.592066 2.609018
FALSE:TRUE:FALSE NA 1.2020815 NA NA
FALSE:TRUE:TRUE 2.234240 2.1410988 NA NA
TRUE:FALSE:FALSE NA NA NA NA
TRUE:FALSE:TRUE NA NA NA NA
TRUE:TRUE:FALSE NA NA NA NA
TRUE:TRUE:TRUE 1.967811 NA NA NA
Cheers,
Alessandro Odasso

